
Excel spreadsheet file used in video: Right-click to download file
The table which you create a pivot table from must have field headers, and should not have any empty cells. There must be no data in the cells surrounding it. Select a cell in the table. Go to the Insert ribbon and in the Tables group the Recommended pivot tables will bring up a dialog with previews of various suggested pivot tables which are created automatically. If none are found that are acceptable you can create your own by clicking Pivot Table in the Tables group to bring up The Create PivotTable dialog:
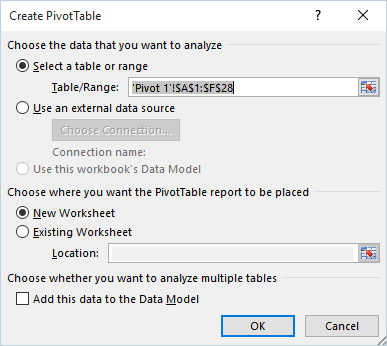
By default Excel will place the pivot table on a new worksheet, if you want it on a different sheet click existing worksheet, then click a cell in the sheet where you want to pivot table. The cell will be the upper left corner of the pivot table when it's created, be sure to have sufficient room for the table below and to the right of the cell.
Click OK to create the table. on the right side of Excel a panel will appear where you design the table.

The Field headers from the table will appear in the top window. below there are 4 windows for Filters, Columns, Rows and Values. To have fields appear in columns or rows drag the fields to the column or rows windows. Drag a field which contains values into the values window. To use a field as a filter drag it to the fields window, a dropdown will appear above the pivot table where you can choose the filter criteria. When you move the fields to the various windows a preview of the pivot table appears on the sheet. Dropdowns for the column and row fields allowing you to sort the fields and filter which fields display in the table. If a filter field was created it will appear with a dropdown above the pivot table.

To format the pivot table go to the ribbon, under PivotTable Tools choose the Design Ribbon.

To change the dropdowns for column labels and row labels to display field names and align the columns, in the Design ribbon Layout group click Report Layout and choose Show in tabular form.

To apply cell formatting to the pivot table click choose or create a design from the PivotTable Styles group in the Design ribbon.

To format the values in the table, right-click on a value and choose Number Format. The Format Cells dialog will appear where you can choose the format for displaying the values.

Formatted Pivot table:

After the table is created, it can be modified at any time in the PivotTable Fields panel.
Drag the fields to the appropriate windows.
To remove an item from the Filters,Columns, Rows or Values window drag it away from the window to sheet area.
When data in the original table is changed the pivot table will not automatically update. When the original table has changed, right-click on the pivot table and choose refresh, or use the shortcut Alt F5. To refresh multiple tables in a spreadsheet use the shortcut Ctrl Alt F5.
The default formulas for values in the pivot table is SUM. If a text field or a value field with an empty cell is dragged into the Values window of the PivotTable fields panel, it will use COUNT.
If the field is a value, then other formulas can be used for the data. Right-click on a value in the pivot table and choose Summarize values by
and select a formula.
Values can be shown in different ways by right-clicking on a value then choose Show Values As, then select an options.
More value options are available by bringing up the Value field settings dialog. Right-click on a value and choose Value Field Settings
In the dialog the calculation for summarizing the data can be chosen and in the Show Values As tab there are options for how the data is displayed. By clicking the Number Format button in the dialog, number formatting can be applied to cells with values.
When you double-click on a value cell in a pivot table the detail data for that value is extracted and is placed on a new spreadsheet.
Values such as dates or times can be grouped in the table, right-click on the date and choose Group. In the dialog which appears choose how the values should be grouped.